- home
-
Products
- Products
- Metrici Custom Applications
- Metrici LPR
- Metrici LPR Parking Module
- Metrici LPR Toll Station Module
- Metrici LPR Weighing Module
- Metrici PPD
- Metrici Area Counter
- Metrici Line Counter
- Metrici QR Code Reader
- Metrici Container Code Recognition
- Metrici Thermal Analyzer
- Metrici Parking Terminals
- Metrici Smart ID Scan
- Metrici Car Kit
- Metrici Server Systems
- Metrici Observer Radar
- Metrici LED Display
- Metrici MultiController
- Metrici LAN Controller
- case studies
- Applications
- Resources
- news
- videos
- Contact
Smart City · Traffic & Mobility Analytics
Your cameras already see the city.
Make them measure it.
Metrici adds AI measurement to the IP cameras you have already installed: vehicle and pedestrian counts, intersection analytics, configured violation detection and plate-level evidence — instead of a new sensor network, trenching and per-spot hardware.
Works with existing IP cameras, where suitable
57+ plate countries and syntaxes
Open HTTP POST / JSON integration
On-premise, private cloud or edge
0Vehicles today +0
0pedestrians counted
0 km/hAverage speed, 14 corridors
0Free on-street spaces
Illustrative dashboard view · Metrici Interface, one database for all engines
Smart city applications
Five things a city can start measuring now
Each group can begin as one corridor, one intersection or one car park, then grow across the city on the same platform and the same hardware.

01
Traffic monitoring and corridor performance
Virtual lines across each carriageway report volume, occupancy and classification per lane, per direction and per hour — continuously, day and night. Travel time between LPR checkpoints shows where a corridor actually loses time, rather than where a survey happened to be taken.
- Volume and classification by car, van, truck, bus and motorcycle
- Directional splits, turn counts and queue length per approach
- Average speed and travel time between checkpoints
Sites Arterial corridors, ring roads, bridges, cordon points
Engines Line Counter · Area Counter · Car Recognition · LPR
02
Intersection analytics and signal timing
One camera set per intersection yields vehicle counts per approach, queue length and waiting time, pedestrian crossings and red-light events. That is the input an operator needs to retime a cycle or extend a pedestrian phase — and the record that shows what changed afterwards.
- Counts, queue length and saturation per approach
- Pedestrian crossings and crossing wait times
- Before-and-after comparison for re-timing and redesign projects
Sites Signalised intersections, school and hospital approaches, transit corridors
Where the traffic controller and the agreed integration support it, Metrici can also provide configured outputs and triggers to external systems.
Engines Line Counter · Area Counter · LPR · Red Light Runner
03
Parking and curb management
Occupancy status per bay from an overhead camera, plate-verified access and tariffs, and reporting on turnover and occupancy across the estate — including resident permits, disabled bays and loading zones.
- Free or occupied status per space, and occupancy counts per zone
- Resident and permit access, tariffs, unified entry and exit reporting
- Turnover, occupancy and dwell per zone for curb policy
Sites On-street bays, squares, park-and-ride, controlled zones
Engines PPD · LPR · LPR Parking Module · LED Display
04
Pedestrian and cycle counting
Crossings, squares, station forecourts, pedestrian zones and event perimeters counted by the same engine that counts vehicles, with a separate profile for people. Footfall arrives as a time series rather than an enumerator's clipboard.
- Directional counts at crossings and entrances
- Crowd density, dwell time and stay detection in monitored zones
- Mode split between cars, cycles and pedestrians
Sites Pedestrian zones, crossings, transit hubs, public events
Engines Line Counter · Area Counter · Pedestrian Detection
05
Violation detection and enforcement support
Rules are configured per camera, per hour and per vehicle class, so detection follows the local regulation instead of a generic template. Each event produces a reviewable evidence record — plate, overview image, close-up, timestamp and rule triggered — for operator validation before any enforcement action.
- Red-light running, with speed and direction of travel
- Wrong-way driving and bus or priority lane misuse
- Restricted or low-emission zones, permits and resident accesses
Sites Signals, bus and priority lanes, restricted and low-emission zones
Engines LPR · PPD · Red Light Runner · Observer Radar
Under all five: one data layer
Counts, classifications and plate reads accumulate in one database with time, camera and image attached. That is the material for SUMP indicators, emission-zone assessments, public transport performance contracts and EU-funded project reporting — produced by the system rather than assembled by hand, and exportable as CSV, direct SQL or HTTP POST / JSON, with retention and role-based access configured to GDPR requirements.
The challenge
Cities are expected to manage traffic with data they do not have
Most operators are accountable for flow, safety, parking revenue and emission targets — while reporting on counts taken by hand, inductive loops that failed years ago, or video that only replays after an incident.
No continuous counts
Traffic volume, mode split and pedestrian flows are measured with one-off manual surveys. Two years later the numbers are stale, and no one can show whether an intervention worked.
Signals on fixed plans
Cycles run to a timetable, not to measured demand. Queues build on one approach while the green phase is spent on an empty one, and pedestrians wait in front of a red light with nothing coming.
Violations that are difficult to document consistently
Red-light running, wrong-way driving, bus-lane misuse and restricted zones are observed but rarely documented end to end. Limited evidence makes enforcement more difficult to sustain and harder to plan against.
Reporting obligations
SUMP updates, emission assessments, EU-funded project indicators and public transport performance contracts all ask for the same thing: dated, auditable mobility data that is difficult to produce by hand.
The Metrici solution · How it works
From camera to decision, on infrastructure you already own
Metrici develops its own video analytics engines in Bucharest. They run side by side on the same video feed, share one database and expose every event through one open interface — so a camera added for parking also contributes to traffic counts. Metrici can work with existing IP cameras that meet the technical requirements of the selected application; camera suitability is assessed during deployment planning.
01
Capture
Existing or additional IP cameras — mast, façade, gantry or pole — stream RTSP/ONVIF to the Metrici server. Day, night and IR are handled by the detection models. On-street bays typically use one camera per 8 to 12 spaces-for a standar pole. The higher they are the more they capture-deozens; depending on the site, cameras may need repositioning or extra coverage.
02
Analyse
Several engines run on the same feed in parallel: LPR, Line Counter, Area Counter, Car Recognition, PPD, Red Light Runner and speed from the Observer Radar. Each object is tracked, classified and stamped per frame.
03
Store and decide
Events, images and counts land in one Metrici database. The Interface dashboard gives operators live views, alarms, reports and audit logs; configured rules decide what becomes an alert, an evidence record or a statistic.
04
Act and publish
Outputs can drive LED signs, barriers and operator consoles locally, and publish every event to your own systems over HTTP POST / JSON, database views or scheduled exports.
On the street
- Existing or new IP cameras, RTSP / ONVIF, 2 MP to 4K
- Metrici LED displays for guidance and driver messaging
- LAN Controller: loops, barriers, relays and scale inputs over the network
- MultiController: LPR bridged with Wiegand and RFID access control
- Observer Radar for speed alongside plate and image
- Car Kit for mobile patrol and enforcement vehicles
On the server
- Metrici engines: LPR, Line Counter, Area Counter, Car Recognition, PPD
- Modules: Red Light Runner, wrong-way, bus-lane and zone rules
- Metrici Interface: live dashboards, alarms, reports, roles, audit trail
- Windows or Linux, on-premise server, private cloud or edge box
- One database for every engine, camera and site
- Licence per camera or per engine, sized to the deployment
In your systems
- HTTP POST / JSON push of events to your platform
- Direct SQL or scheduled CSV export for BI and GIS
- Traffic management and control-centre platforms
- Parking operator, payment and administrator back-ends
- Public variable-message signs and citizen apps
- Integration support and documentation from our engineers
From measurement to signal timing
Traffic counts, queue measurements and pedestrian activity give traffic operators the information needed to optimise signal timings. Where supported by the traffic controller and the agreed integration, Metrici can also provide configured outputs and triggers to external systems. Historical series let the same rules be reviewed after every change, and anomalies such as a sudden surge or a blocked lane are escalated to the operator within seconds.
| Procurement question | Metrici AI on IP cameras | In-ground / per-bay sensors | Manual surveys & patrols |
|---|---|---|---|
| New civil works | May avoid additional civil works when suitable cameras and network are available | Trenching, lane closures, permits | None |
| Cost per additional point | One camera can cover several lanes or spaces | Typically priced per spot or per loop | Priced in staff hours |
| Maintenance profile | Software updates; reduces dependence on in-ground sensor maintenance | Battery and sensor replacement in carriageway | Continuous staffing |
| Coverage per feed | Counts, classification, plates, occupancy, configured detections | Occupancy or presence only | Spot sample, operator dependent |
| Evidence for enforcement | Provides vehicle identification when combined with LPR | No vehicle identity | Officer notes |
| Time to first live data | Deployment time depends on camera readiness, integrations and project scope | Weeks to months, including works | Immediate, then periodic |
| Reuse of the asset | One feed can serve traffic, parking, transport and security | Single purpose | Single purpose |
Benefits
Operational gains first, financial ones follow
The business case for video analytics is usually built on four things: capital you avoid spending, staff hours you redirect, revenue you stop losing, and evidence an operator can act on.
Operational outcomes
Continuous measurement
24/7 counts replace episodic surveys. A baseline exists before a change, and the impact of that change can be measured afterwards with the same instrument.
Fewer staff hours per site
Automated detection and evidence capture shift staff time from routine observation to case review and supervision, so one operator can oversee several areas.
Structured evidence for operator review
Plate, image, timestamp and the rule that was triggered in one record, with a review step before any enforcement action — a reviewable evidence record rather than an anecdote.
Faster incident response
Wrong-way entry, a congestion surge or an obstruction can be alerted while it is happening, with the relevant camera already open in the control room.
Financial outcomes
Existing camera investmentWhere suitable cameras and network are already in place, capital goes to compute and licences rather than to new civil works and per-spot hardware.
Incremental coverageOne camera can cover many spaces or several lanes, so extending coverage is usually a marginal addition rather than a repeat of the original project.
Recoverable revenueContinuous occupancy detection with plate-verified enforcement helps close the gap between spaces sold and spaces actually used.
Fundable with dataMeasured baselines and auditable indicators support grant applications, SUMP reporting and performance contracts.
Building the business case
Tell us your corridor, car park or intersection and we will scope it with the numbers you actually need: cameras required, servers, engines per site, licence model and a phased rollout. In Bârlad, seven LPR access points handling around 3,000 cars a day reached a reported payback in 18 days — we will model yours on your own volumes rather than on ours.
Real implementations
Deployed in Romanian cities, running in production
Public administration deployments where the platform handles daily traffic, access and parking decisions — not a pilot that stayed a pilot.
 Bârlad · case study
Seven access points, one revenue system
A commercial and residential district entered through seven gates was leaking parking revenue and had no shared view of traffic. Metrici LPR now identifies vehicles at every gate under a single platform, with unified reporting across all entry and exit points.
7 gates~3,000 cars / day18-day paybackCity-wide expansion
Read the case →
 Sibiu · case study
Parking, access and traffic in a historic centre
Tourism and transit pressure in one of Romania's most visited cities. Eight LPR cameras support resident access, paid parking and traffic control, giving the administration one data source for curb management around the historic core.
8 LPR camerasResident accessPaid parkingTraffic control
Read the case →
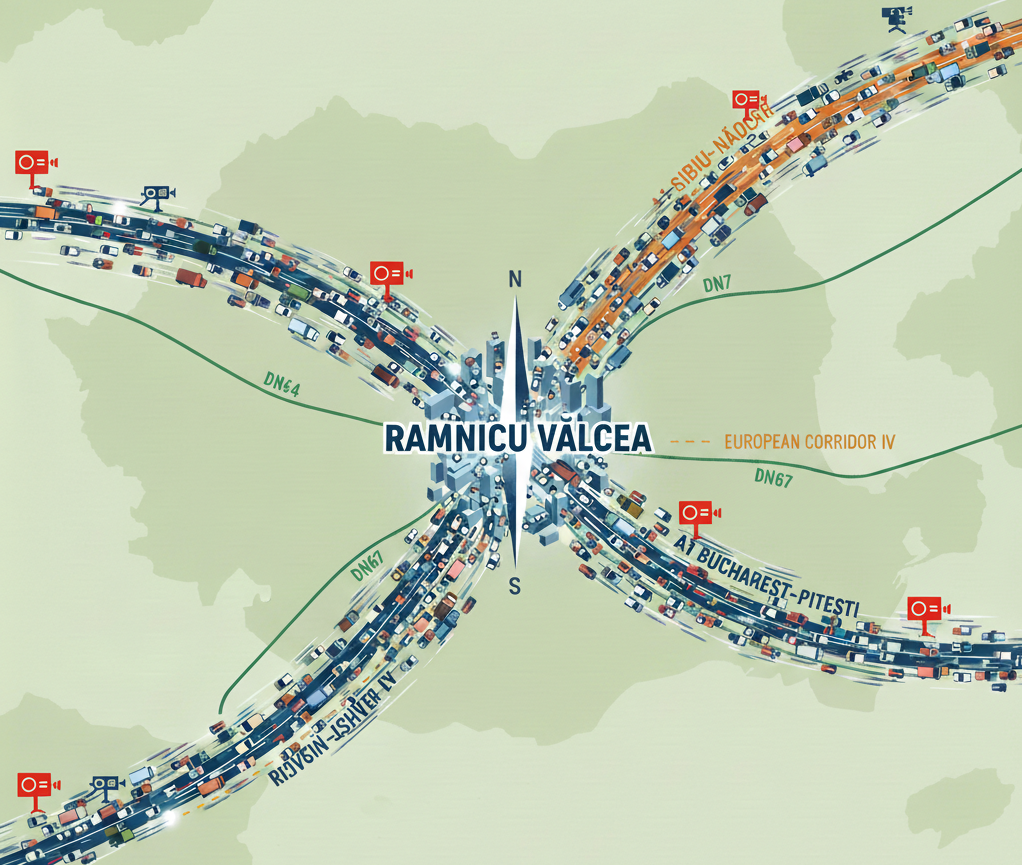 Râmnicu Vâlcea · case study
City-wide surveillance at every entry and exit
A city on European Corridor IV needed to know what crosses its boundaries. Eight cameras cover the entry and exit routes after earlier trials failed, providing plate-level visibility for police and administration use.
8 camerasAll entry / exit routesPolice & administration
Read the case →
 Bucharest campus · case study
Access control across 100 hectares
Romania's largest university campus — around 25,000 people a day — replaced manual gate checks with six LPR cameras, giving authorised vehicles a barrier-free entry while unauthorised access is logged instead of waved through.
6 LPR cameras100 hectares~25,000 people / day
Read the case →
Also relevant: counting at scale, and for transport operators
The same counting engines that measure city pedestrian flows were deployed at the UNTOLD festival, where entry and zone counts have to hold up for safety planning — the same behaviour cities see on market days, match days and holiday departures. Bus and tram corridors, railway stations and intermodal hubs use the same engines for vehicle tracking, queue lengths at stops and passenger counts feeding real-time displays — see the public transport applications.
Products and integrations
Modules a city deployment typically combines
Licensed per camera and per engine, on the same platform. Start with one, add the others without migration.
Metrici LPR
Plate recognition for 57+ countries and syntaxes, day and night, with image and event per read.
Metrici Line Counter
Directional counts across virtual lines: vehicles by class, bicycles and pedestrians.
Metrici Area Counter
Occupancy and counting inside defined zones: squares, platforms, forecourts, event areas.
Metrici PPD
Parking Place Detector: free or occupied status for every bay from one overhead camera.
LPR Parking Module
Entry, exit, tariffs, access rights and reporting for municipal and mixed parking estates.
Red Light & Speed
Configured violation detection at signals, with plate, images and speed evidence per event.
Observer Radar
Speed measured alongside plate and photo, with LED feedback for traffic calming zones.
Metrici LED Display
Free-space counts, warnings and routing messages driven live from the same data.
Metrici LAN Controller
Loops, barriers, relays and scale inputs controlled over the network from one device.
Metrici MultiController
LPR bridged with Wiegand and RFID access control in one industrial device.
Metrici Car Kit
Mobile LPR for patrol and enforcement vehicles, reading plates on the move.
Custom applications
Detection rules and interfaces built around a regulation or platform requirement.
Integration and data ownership
A city keeps its own stack: Metrici publishes events and statistics rather than holding them hostage.
RTSP / ONVIF camerasHTTP POST / JSON eventsDirect SQL accessCSV scheduled exports
Traffic management platformsParking operators and payment systemsPolice and administrator back-ends
LED variable message signsBarrier, relay and loop controlWiegand / RFID access systems
BI and GIS toolingWindows · Linux · edge serversGDPR data retention and role-based access
Next step
See your own corridor on the platform
Send us a camera feed, a site plan or just the name of the intersection. We will show you what the engines measure there, and scope the cameras, servers and licences a phased rollout would need.
01 · SCOPE
30-minute technical call
Your corridors, sites and regulation. We identify which engines apply and what your current cameras can already support.
02 · PROVE
Pilot on your video
One corridor, one intersection or one car park, measured live with counts, events and reports you keep.
03 · ROLL OUT
Phased deployment
Staged expansion with defined acceptance criteria per phase, integration into your platforms, and training for operators.